GNU C Library Utility: memusage
memusage is a practical glibc utility for memory profiling.
I was looking through my old notes to find something interesting to write about. I found a little C snippet that I used to check how memusage utility reports memory usage.
memusage is a bash script available as part of glibc. This is a utility that profiles memory usage of given program by preloading libmemusage.so library, which intercepts malloc, free etc.
It can optionally generate usage charts as well, via memusagestat.
I only ever used this to profile memory usage of small standalone programs that quickly terminate. So I am not sure how useful it is for different scenarios.
Here is a small test program that:
- makes multiple batches of allocations,
- each batch followed immediately by deallocations,
- and then terminates.
#include <stdio.h>
#include <stdlib.h>
#include <time.h>

#define N_ALLOC 10000
#define S_ALLOC 1024

int main ()
{
    // Sleep time represents 1 frame time in 60fps.
    struct timespec sleep_timer = { .tv_sec = 0, .tv_nsec = 16666667 };

    // Arrays storing pointers to allocations.
    void * a0[ N_ALLOC ];
    void * a1[ N_ALLOC ];

    for ( int i = 0; i < N_ALLOC; ++i ) { a0[ i ] = malloc( S_ALLOC ); }
    for ( int i = 0; i < N_ALLOC; ++i ) { free( a0[ i ] ); }

    for ( int i = 0; i < N_ALLOC/2; ++i ) { a0[ i ] = malloc( S_ALLOC*7 ); }
    for ( int i = 0; i < N_ALLOC/2; ++i ) { free( a0[ i ] ); }

    for ( int i = 0; i < N_ALLOC/3; ++i ) { a0[ i ] = malloc( S_ALLOC*3 ); }
    for ( int i = 0; i < N_ALLOC/3; ++i ) { free( a0[ i ] ); }

    nanosleep( &sleep_timer, NULL );

    for ( int i = 0; i < N_ALLOC; ++i ) { a0[ i ] = malloc( S_ALLOC ); }
    for ( int i = 0; i < N_ALLOC/2; ++i ) { a1[ i ] = malloc( S_ALLOC*7 ); }
    for ( int i = 0; i < N_ALLOC/2; ++i ) { free( a1[ i ] ); }
    for ( int i = 0; i < N_ALLOC; ++i ) { free( a0[ i ] ); }

    return 0;
}
I compiled this to an executable called memusagetest. Here is the command I used to run the resulting executable with memusage:
memusage -m -t -T -x 740 -y 370 -p memusagetest.png -- ./memusagetest
Below is the console output (briefly modified to fit the page):
Mem usage summary: heap total: 102398976, heap peak: 46080000, stack peak: 1616
         total calls   total memory   failed calls
 malloc|      33333      102398976              0
realloc|          0              0              0  (nomove:0, dec:0, free:0)
 calloc|          0              0              0
   free|      33333      102398976
mmap(r)|          0              0              0
mmap(w)|          0              0              0
mmap(a)|          0              0              0
 mremap|          0              0              0  (nomove: 0, dec:0)
 munmap|          0              0              0
Histogram for block sizes:
 1024-1039        20000  60% ==================================================
 3072-3087         3333   9% ========
 7168-7183        10000  30% =========================
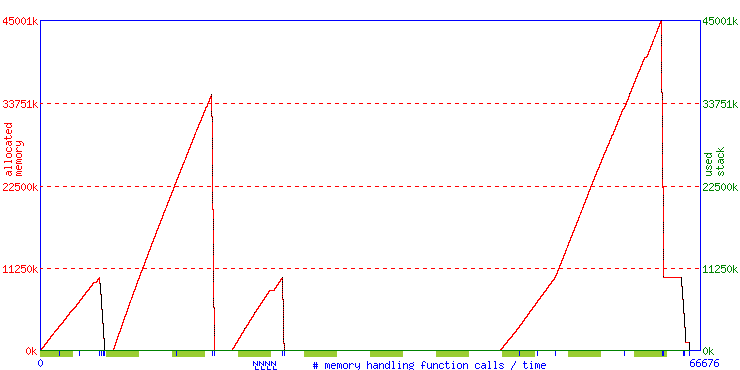
The generated memusagetest.png file looks like this:
Thanks for reading! If you find technical errors, please report in the blog’s Issues page.